


Government bonds rallied hard last year as a result of the pandemic. However, as confidence has built in the economic recovery, yields have backed up. From the low of around 0.5% in August last year to the March high, the 10-year US Treasury yield rose by around 1.2%. Moreover, because duration is high as a result of the low level of starting yields, capital losses have been relatively large.
Should we be concerned about the potential impact on the economy resulting from higher borrowing costs? What are higher yields telling us about inflation expectations? And will bond yields continue to move higher? asks Daniel Murray, global head of research at EFG Asset Management.
Recent experience in an historical context
Chart 1 below shows the 10-year US Treasury yield (T10) over the past 30 years together with CPI inflation and highlights periods during which the T10 yield has risen by at least 100bps within a period of six months or less.
It illustrates a number of interesting things.
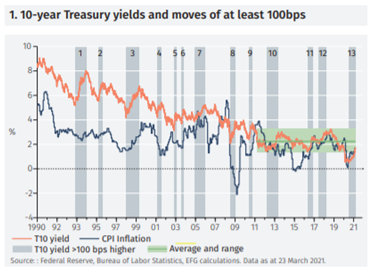
First, from mid 2011 to the beginning of last year immediately prior to the crisis, the T10 yield traded in a range between 1.36% and 3.24%. The lurch down in yields as the crisis hit is understandable against the huge uncertainty that erupted at that time. However, as the uncertainty has faded the T10 yield has returned to the lower end of its prior range. This seems reasonable as the risks have subsided. If that process were to continue, the yield might well rise further although this would not necessarily signal anything other than continued reversion to the pre-covid situation.
Secondly, the recent increase in yields has been accompanied by a similar and coincident increase in CPI inflation. Whilst the relationship between the T10 yield and inflation has varied historically, over the past four years it has been reasonably tight. The recent back up in bond yields may, therefore, be viewed as a reaction to the rebound in inflation from the very low levels of last year. Yields have risen not in anticipation of higher inflation but in concert with it.
Third, note the size and speed of the move. The average yield reversal from bottom to top over the previous 12 episodes was 1.59% and took 234 days. It could be argued that we should look only at the previous three episodes given the lower level of yields over that period and the potential impact of quantitative easing: the average yield increase over episodes 10 to 12 was 1.31% and took 273 days. The most recent episode has seen the T10 yield rise by 1.21% over a period of 227 days, which looks unexceptional both in terms of size and time.
Potential economic impact
There are two primary factors to consider with regard to the economic impact:
- (i) real yields
- (ii) the slope of the curve.
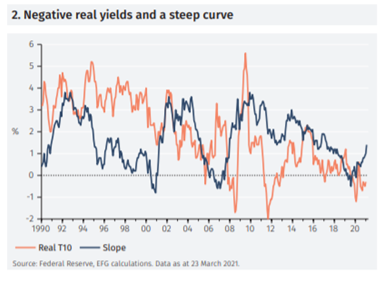
Both point to ongoing economic recovery. As shown in Chart 2, real yields – nominal yields less inflation – remain firmly negative, despite the recent increase in nominal yields. This implies that borrowing remains very cheap, something that is supportive of economic activity. Furthermore, because longer dated bonds have sold off as the short end has remained well anchored, the yield curve has steepened meaningfully since the middle of last year. As has been well established in economic literature, a steep curve is a positive and reliable signal for growth over the following 12 months.
Debt service costs
Investors also fear that borrowing costs will rise sharply as a result of higher yields creating stress in debt markets. However, as Chart 3 shows, debt servicing costs remain well contained in the US, suggesting the economy can withstand a significant rise without causing stress, despite the large increase in private and public sector debt outstanding.
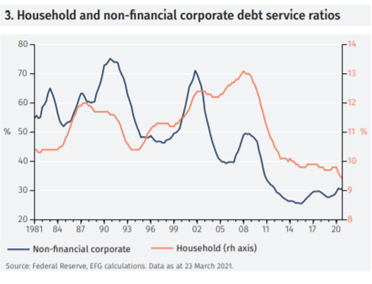
Household debt servicing costs are at an all-time low relative to income while the nonfinancial corporate debt service ratio is only marginally higher than its 2015 low point. Similarly, government debt service costs remain low as a result of low bond yields. Affordability is also reflected in credit markets by virtue of the fact that spreads remain tight, both in investment grade and high yield debt.
While some sectors will undoubtedly experience coronavirus-related challenges over the next few months, there is no evidence that the problems are economy wide. It is true, at the same time, that the average maturity of debt has increased over the past few years, something that reduces corporate funding pressures. For example, the maturity of the ICE Bank of America US Corporate Index has increased from a little over 10 years in 2018 to a bit under 12 years today.
Conclusions
The sharp run up in bond yields since last summer has fuelled concerns about rising inflation and the potential for tighter market financing conditions to dampen the prospects for economic recovery. However, overall the move looks to be more about normalisation after the unique situation of the past year rather than anything more sinister. If that normalisation continues and the pre-covid range serves as a good guide, it is possible that yields will rise further.
However, such a move should not be confused with an increase in market fears about inflation nor should it be seen by itself as something that is damaging to US economic prospects.
This article was written for Expert Investor by Daniel Murray, global head of research at EFG Asset Management.